Showing posts with label tools. Show all posts

Using Mind Maps

Mind maps is a visual way to structure information in a tree like structure. Such maps are convenient way for structuring knowledge, ideas, plans and tasks.

Usually, mind map starts with a root node, which has references to child nodes. References do not have names, but color can be use to code specific subjects. Each node, except root, has a parent node. Child represents some information specific to its parent node. This helps to build a tree of information, that can be easily consumed by human.

I am a big fan of visualization. Good visualization represents complicated things in a simple way that is easy to understand. Mind maps is one of the simplest but effective visualization techniques. It helps me in many different places: from making notes to managing projects.

MindNode

I’ve spent a few days looking for mind map tool that I would love to use. At the end, I’ve picked MindNode, a beautiful tool available for macOS and iOS. It has a few very interesting features that I just love and won’t be able to live without anymore:
  1. There is an app for iOS, so I can work with mind maps using my iPhone and iPad. Experience is very similar to desktop application. Device app works smoothly; I never had issues with creating/updating maps from my phone.
  2. iCloud integration allows me to share maps between devices and computer.
  3. Multiple themes are available by default. Moreover, I can modify existing theme to create my own. I usually use different themes to differentiate different types of maps.
  4. Node can be marked as a task. For parent task, it will convert child nodes into tasks. Parent task can be used to track progress. Tasks mechanism is intuitive.
  5. MindNode allows to attach URL and description to node. It’s possible to create a documentation using mind map; MindNode can easily convert it to Markdown document.
  6. Additional relationship between nodes can be created using links. I do that quite often to connect two nodes that are in different parts of map.
  7. Awesome keyboard shortcuts support: can do most of work without touching touchpad.
MindNode has many more useful features, like: sharing mind maps with others using web interface, attaching media resources to node, exporting map into different formats etc.

Usage

As I’ve mentioned above, I use mind maps for different use cases. Most common are:
  1. building a knowledge
  2. generating ideas
  3. planning and managing projects
Next, I give more description on each of those.

Building knowledge

I found that mind maps work better for me than text notes. It is easier to read mind map: easy to detect most important parts, faster to read map in larger batches, references are an important mechanism to add extra dimensions to data. It is possible to collapse graph to see only the most important parts, and if need, dig deeper for more insights. Branches have different colors to separate them visually.

It is often hard to structure new mind map in the best way. I usually start with something that works right now, and do refactoring once gathered enough information, and there is a need in a new structure.

For me, map is a better way to collect and hold my notes. Before, I usually collected notes for each source of information (i.e. had different notes for different books). Therefore, it was hard to get through and find useful information. Things changed with mind maps - I collect knowledge per subject. For example, I have mind maps for such subjects as “Software Engineering”, “Writing”, and “Machine Learning”. I update those with facts, ideas, and best practices.

Here is example of my mind map for Software Engineering (all branches are collapsed for better visibility):


One of its sections focuses on making projects in a right way:


Such maps usually contain a branch for subjects that I want to research next. Those are represented as tasks, and help track my work on improving my knowledge base, follow up on missing parts etc.


Generating ideas

When working on new projects, it is important step to generate ideas for features, approaches and solutions etc.

I also found mind maps are quite helpful in this realm. When I need to brainstorm features, I start with a node “Features” and add child node for each high level feature. Afterwards, I extend feature node with more details and clarifications using its child nodes and so on and on.

Here is an example of features ideas for some service that I was scoping before. I start with some high level feature description, like “Integration with other tools”, and then move forward to clarify and add details.


And again, branch to track work on further research is a must:


Planning and managing projects

Most of the projects that I start nowadays begin with a new map in the MindNode. Map consists of the main parts: design, risks, scope of work, and plan of work.

I usually don’t go much into details in the map; I use another tools for documentation and sharing. Map stays private to me, as it has many details and thoughts that aren’t necessarily useful for others.

I leverage tasks support a lot in such mind maps. They help me to track work progress and also make sure there are no forgotten nuances and risks.

Because mind maps are so easy to read, many times I was able to find forgotten or missed work for various projects. This helped me a lot, as otherwise we would either get a bug during testing or wouldn’t be able to launch on time. I believe, only text notes couldn’t have helped me in such cases.

However, I do not use mind maps for anything that requires lots of text. Documentation, design notes aren’t part of my interaction with MindNode. I also do not use mind maps for actual tasks and tracking work. There are better tools for these use cases. However, where mind maps are great at defining ideas for design, adding pros and cons, risks and vision; maps are also great for defining list of milestones and high level stories.

Summary

If you’ve never tried mind maps before, and also looking for a way to manage through your life and on work, then give a shot to mind maps.

MindNode is a tool that I’d recommend the most, assuming you are using macOS/iOS and ok to pay around $30.

Structured Aggregated Log

Introduction

Structured logging is an approach to logging where information is written in a structured form, that later could be read and parsed by machine with minimum efforts. In many cases, it means that immediate readability of the log is reduced, but with a bit of efforts it could have an opposite effect (we’ll see it a bit later).

Such different Structured Logging

This structure can be anything: from comma separate list of values to complex JSON/XML documents.

Structured logging’s another important difference is focusing on logging larger number of information in batches.

For example, you have an application that reads data and passes those through a chain of rules. Each rule can either vote to execute some specific action over those data later or not.

There are a few approached to logging data here. Lets review them.

Unstructured log line. Each class writes a log line with information it currently contains. There is no common structure for log printed by each rule. Thus easy to notice a different ways of saying the same. In logs below, one rule says ‘Voting for action’ while another says ‘action is picked’. Some rules print important information and others don’t. Such logs can be parsed by human but not always by computer.

Structured log line. This is better. At least same approach is used for logging all information. Yes, it is not always easy to read by human, but it is in a state where both human and computer can read and interpret those logs.

Structured aggregated log line. Simple here: you gather all the “execution” data and then output them at the end in a single structured log line. In this case it is preferable to use JSON or XML to structure the information. CSV most probably won’t be the best option here, especially because it doesn’t support nested structures. Pros: you have a single line with all data. Cons: you need to keep those data until final log line is generated and also it is hard to read those without practice or a formatting tool.

Which one is my favorite? – The last one!

Why? – Because it can hold important information in a single line and save me from grepping and parsing multiple log lines.

Structured Aggregated Log Line

For structure aggregated log, there is a little help from most of logging frameworks. So this functionality needs to be built manually.

Main components of structured aggregated log are aggregated log collector, data formatter and logging framework to output.

AggregatedLogDataComponents.png

Lets get deeply into pros and cons of structured aggregated log line.

First start with good things:

  1. You have all information aggregated into single log line
  2. When using JSON or XML, you could benefit from auto-formatting tools
  3. Even better for program to parse and read data from such log line
  4. Better control on output data:
    1. Customize output strategies
    2. De-duplicate data (printing same thing once)
    3. Structure data in usable way that simplifies understanding
  5. De-duplicating log metadata: skip printing duplicate date/time, level and source of logs etc.

There are of course bad things:

  1. Probably is not supported by “your favorite” logging library. So need to be implemented manually
  2. Need to store aggregated data, and also building a JSON/XML document to print
  3. Average log lines become huge and hard to parse by human (however auto-formatting tools help a lot)
  4. Logger should support printing partially populated aggregated data (more on this below.)

I’m going to deep dive into some items mentioned above to explain in details and, if possible, with examples.

Auto-formatting

This is simple. You found a log line, copied it into auto-formatting tool, pressed the button and you have a well formatted and easier to understand log:

formatted_structured_log.png

Customized output strategies

This one is quite important. As you have aggregated data and you need to generate your log line, it becomes similar to how you generate a “view” based on “model” in MVC pattern.

You can do many useful things now:

  • generate JSON log line, or XML
  • generate short log line with the most important information for successful use
  • or generate a long log line full of all aggregated data in case error or exception happened
  • filter out unimportant and don’t print them into output log
  • etc.

De-duplicating data

Lets compare examples of unstructured/structured log lines:

They both have a date/time and log level and request id for every log line. We get rid of this duplicate data if we print all data in single line.

But that’s not all. In both use cases, TrafficLightIsGreenRule and TrafficLightIsRedRule print traffic light status. Those are independent rules, and traffic light is important for both of them so they both print it. However, in structured aggregated log line, we print traffic light status only once.

Handling errors

Errors happen. So might happen one before you’ve aggregated all the data and printed them into log. How to deal with this? The most important here is to not lose data aggregated for logging: those need to be printed in any case even though they aren’t complete. Those would be invaluable source of information during error investigation.

Often it is possible and recommendable to print exhaustive data into an aggregated log.

Or alternative would be to collect error message and stack trace into the aggregated log data:

Presentation

As mentioned before, one of the strong benefits of structured aggregated log line is presence of important data in a single line. And this line is in the format that easily understood by machine.

This allows to read data out from the log and do various manipulations. Like generating a better way to present and work with data.

I tried to imagine a way I could get a JSON log line, parse out data from it and convert into readable HTML document, that gives me a better view of data. For sure, this is not very helpful with mine trivial example. But for a larger logs this is more beneficial.


HtmlPresentation.png

Creating a simple tool where you can paste a log line and get such presentation of data wouldn’t be a big task. But would help to decrease a level of operational load.

Twister: A Simple Way to Manage Your Scripts

Imagine an average project that has many scripts, each written using different practices, uses different argument names, different namings, does something similar to other script but a bit different etc. Sometimes there are so many scripts, that it's hard to find the one you really need at this very moment. Moreover, scripts have no standard location, often put in semi-random directories, so it's really hard to find them. And even more, many developers have similar scripts for different projects. Some scripts are in the PATH, others are relative to the project directory. The one in the PATH are named in odd manner, because different versions used for different projects. And some scripts are written using bash and ruby and python etc.

Oh, so many troubles just because of the scripts. That's the reason why Twister was created. Twister is a simple framework/tool that allows to create and manage project scripts. I use it in a few of my home projects, and find it very helpful. About a year ago, I open sourced Twister. It's a python project, so it makes it simple to create scripts and execute them on any popular operating system.

Android Emulator Snapshot

Here I'm going to describe a simple way to decrease a start up time of the Android Emulator. This is possible after snapshot saving and loading option is enabled.

Open your terminal and enter the command:

$ android

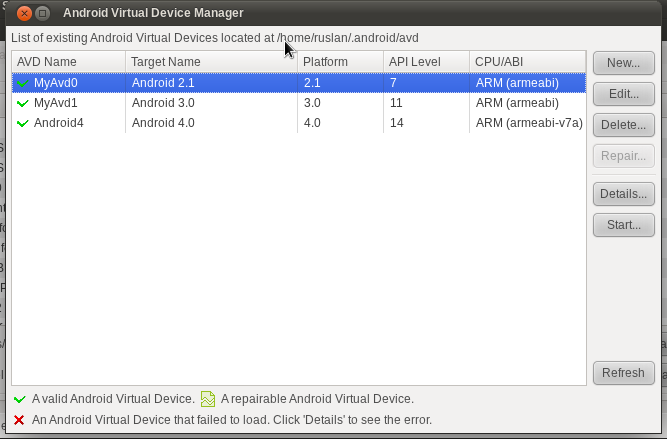
Open Android Virtual Device Manager from menu Tools -> Manage AVDs... You'll see a window like this:


AVD Manager


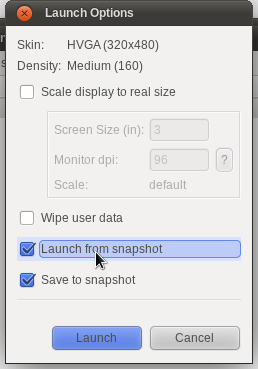
Select your working AVD from the list and click on "Edit" button. In the opened dialog check on to enable Snapshot. Save changes. Then click on the "Start..." button and check "Launch from snapshot" and "Save to snapshot" options.


Launch options


If you haven't enabled "Saving to snapshot" option before, it may take a time to start the emulator first time. After it is started, you can close it and start again. This time emulator will be started much faster.

Get Total Commits Number in Git

In a few weeks there will be an anniversary as I've started working on current project. So I decided to find out the total number of made commits from the project begin. While it's obvious for Subversion, in Git you need something more that just look at the revision number.

First, I came out with a simple command that prints the total number of commits:

$ git log --pretty=format:'%h' | wc -l
prints out
2485

This is a bit primitive and that wouldn't be such a simple solution if need to find the total number of commits per author. I didn't want to believe there is not better way to get the total number of commits per author with standard Git tool.

After a few minutes of research I found there is a simple and powerful util git shortlog.

So next command

$ git shortlog -n -s
prints out
  2317  Ruslan Khmelyuk
   104  Author_1
    53  Author_2
     9  unknown
     2  Author_3

I've summed the commit numbers for each committer and found that the total commits number by git shortlog command is 2485 and that is equal to the result of git log | wc -l command. While git rev-list -all | wc -l command prints there are 2488 commits in the repository. Strange.

Short investigation helped me to understand that both commands working fine and show correct number. The difference between commands

$ git log --pretty=format:'%h' | wc -l
$ git shortlog -n -s
and
$ git rev-list --all | wc-l

is in the source they're using to calculate commits list.

git log and git shortlog use current branch commits log, while git rev-list uses all repository as source of commits list. I had 3 more commits in the other branch, so in my local repository I had in total 2488 commits.

Even more, If you need to calculate the total number of commits in the remote repository, you will need to use git rev-list command:

$ git fetch origin
$ git rev-list --remotes | wc -l

Thus I can say, that git rev-list command works best to find out the total number of made commits.

Linux tools to generate password

Few days ago was looking for simple tool to generate passwords in linux console.
As result of my searching are 3 useful tools. They are:

  • apg

  • makepasswd

  • pwgen


apg


Install: sudo apt-get install apg

Asks to enter random data, that should be used to generate new password.
Example:

Please enter some random data (only first 16 are significant)
(eg. your old password):>
Opt8Ovuf (Opt-EIGHT-Ov-uf)
Uc1Gryec (Uc-ONE-Gryec)
jadJoav5 (jad-Joav-FIVE)
IshtIvawam3 (Isht-Iv-aw-am-THREE)
lakVosAfUrg7 (lak-Vos-Af-Urg-SEVEN)
dyijDus8 (dyij-Dus-EIGHT)

You can pass random string as parameter and use many different options:

$ apg -n 10 -m 8 -x 12 somerandomdata

Will generate 10 passwords with min length 8 and max length 12.

makepasswd


Install: sudo apt-get install makepasswd

Generates password, by default one. User may need to use options to set length of password and count of passwords. For example:

$ makepasswd --count=10 --minchars=5 --maxchars=10

Results:

mzd4f9q
gUWamL
NYiUXrYvq3
6hWDXKA
gQpu20IJGD
BSAT5ASFX
37FcKyLPb
ma7pC66A
cFpWPBy
0oTNhT7


pwgen


Install: sudo apt-get install pwgen

My favorite tool to generate password. By default generates 160 different passwords each with length 8 symbol. Programs takes 2 parameters:
- 1st is the length of the password and
- 2nd is the count of passwords to generates. For example:

$ pwgen 12 24

Results:

oHo2iethieze cheiS6ohPeed Oozufiorohv9 eic3aethei4L hiRohYie6Ue4 aephoiDieb0y
hieTh8eizaeK aid1EeNgaiSe yoh6chohX9ha aiPhae7dieMe wedooD8nai7y aic7deeB9eS8
ohFor3Achied Thaequu4aiph zaeghiem7keT Shee5ooxaex0 wePh2eiNgien aicohroo2Go3
Aagh0gahcah0 Zie8eazaitah aoha9AeXi7Bo Oojoob0oosh6 Olahgh4aeji6 oobae9UZ2phi